Sales KPI Dashboard built on Tableau
At the bottom of this page is the interactive dashboard created using Tableau. This dashboard was built for a sales agency to track their key performance indicators (KPIs). For demonstration purposes, I’ve populated it with dummy data to maintain security.
Dashboard Features
Interactive Filtering
The dashboard offers multiple ways to filter and analyze data:
- Date range selectors at the top
- A filter toggle button for cleaner screenshot exports
- Click-to-filter functionality on every metric displayed
Custom Tooltips
Each visualization comes with detailed tooltips that provide additional context. For complex metrics, these tooltips can be expanded to include comprehensive explanations and calculations.
Navigation Bar
The left-side navigation bar includes:
- Quick links to relevant websites (Company website, LinkedIn, YouTube)
- A PDF download button for easy sharing with clients and colleagues
- Access to the detail dashboard.
Detailed Data View
The “Detail Dash” provides access to the raw data behind all visualizations. Users can:
- Filter and sort data directly
- Export filtered datasets to CSV
- Troubleshoot discrepancies
- Share raw data with clients when needed
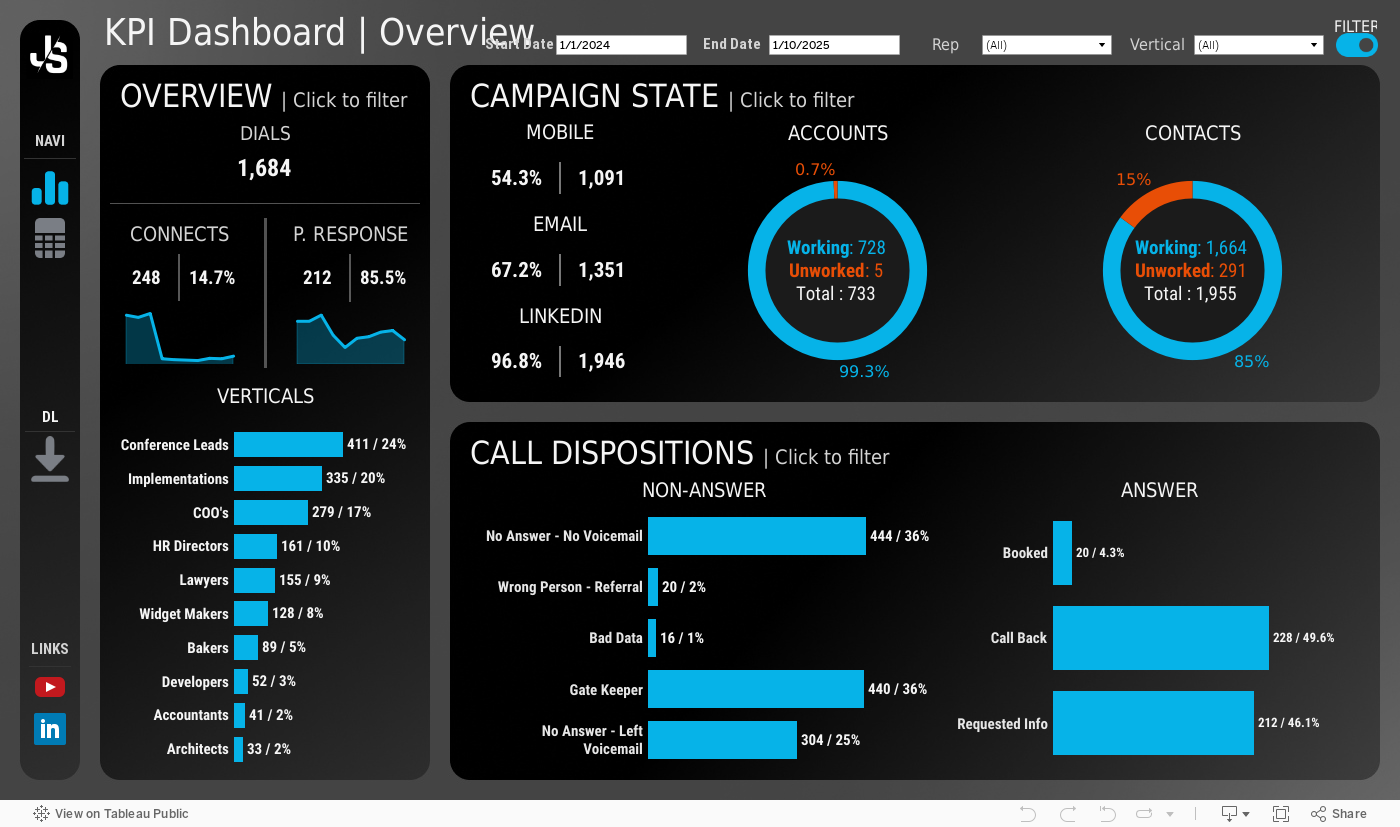
Data Visualization
The dashboard presents several key metrics:
- Dial and connection rates
- Campaign performance across different channels (Mobile, Email, LinkedIn)
- Call dispositions with detailed breakdowns
- Performance metrics by vertical market
KPI Dashboard
Please View on Desktop
This dashboard is optimized for larger screens. For the best experience, please view on a desktop or laptop computer.